That's the way the Ball Bounce
As the ball bounces up and down, the maximum height it reaches continually decreases from one bounce to the next. For any particular bounce, if the ball's height is plotted as a function of time, the resulting graph has a parabolic shape. The relationship between height and time for a single bounce of a ball, then, is quadratic. Expressed mathematically:

where y represents the ball's height at any given time, x. It is possible to mathematically model a ball's bouncing behavior using a series of quadratic functions.
In this activity, you will record the motion of a bouncing ball using a Calculator Based Ranger (CBR). You will then analyze the collected data and attempt to model the variations in a bouncing ball's height as a function of time for one particular bounce.
YOU NEED:
1 CBR unit
1 Ball (racquetball or basketballs work well)
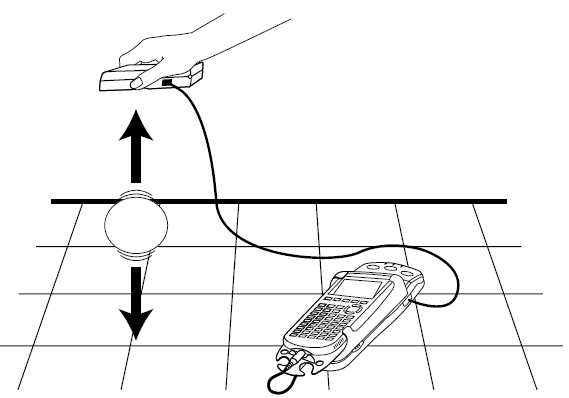
PRIOR TO THE ACTIVITY, MAKE THE FOLLOWING PREDICTIONS:
Make a prediction of the height
from the floor as a function of time.

2. Make a prediction of the distance from
the CBR as a function of time.

INSTRUCTIONS
Be sure the ball is bounced on a smooth surface. Do not allow anything to
obstruct the path between the CBR and the ball while data is being collected.
Run RANGER on your calculator by selecting it the CBR/CBL
app.
From the Applications menu of RANGER, Choose meters as the units.
Select 3:Ball Bounce.
Be sure to hold the CBR at least 1.5 meters from the Ball when collecting data.
ACTIVITY DATA
The resulting plot of distance versus time should appear to
be a series of parabolic sections with decreasing maximum
heights.
If you are dissatisfied with your results, press ENTER
and choose Repeat Sample to recollect the data.
Once you are satisfied with the results, make a sketch
of the height versus time plot. Include the units and values along each axis.
SELECTING THE DATA:
We will analyze the data for one parabola. From the LIST menu, arrow right
to OPS and choose 8:Select(. The select feature allows you to choose a portion
of the graph and place those data points into another set of lists. You type the
lists where your want to place the new data separated by commas. For this
activity, place the data in L3 and L4. Your home screen should show Select
(L3,L4). Press ENTER and you will be taken to the graph. Move the
cursor to the beginning of the parabola that you want to choose. Avoid the sharp
point unless you are sure it is part of the parabola that you want. Press
ENTER to mark this point. Move the cursor to the end of the parabola and
press ENTER. The plot will now show the selected data which is located in
L3 and L4.
Sketch the selected data in the space to the right.
Questions:
1. In this activity, the ball bounced straight up and down beneath the CBR,
yet the data plot seems to depict a ball that is bouncing sideways. Explain why
this is so.
2. Press TRACE. Move along the height versus time plot and estimate the
x- and y-coordinates of the vertex of the parabola (in this case, the maximum
point on the curve). Record these values in the table below.
| vertex | |
| x-coordinate | y-coordinate |
3. What do the x and y coordinates represent physically?
4. The theoretical model for the height vs time data is
quadratic. We will attempt to fit our data with a quadratic function of the
form:

where b is the x-coordinate of the vertex, c is the y-coordinate of the vertex,
and a determines the parabola's dilation (stretch or spread). This model is
sometimes called vertex form.
5. You will use an application, Transformation Graphing, to help you fit the equation to this data. Press the [APPS] key and select Transfrm.
Press Y= and move the cursor to Y1. Enter the equation Y = A(X - B)^2 + C and then press GRAPH . Move the cursor the B on the screen and enter the value for the x-coordinate of the vertex. Move the cursor to the C and enter the value of the y-coordinate of the vertex.
6. To obtain a good fit, you will need to adjust the value
of A. Use the method described above to store different numbers to the variable
A. Record the A-value that works best in the space below:
A = ______________
7. It is also possible to express any quadratic function
in the general form, as described earlier:

where the coefficient a is identical to that found in question (6) above, but b
and c are different. To determine these coefficients, substitute the proper
values for A, B, and C found above into the quadratic expression from question
(2), expand it, and collect like terms. Record the corresponding values of a, b,
and c in the table below:
| a | |
| b | |
| c |
8. The calculator has a built-in feature that allows it to
compute the best-fitting quadratic equation through a set of data. To perform a
quadratic regression on the data that you selected, press STAT arrow
right to CALC. Select QuadReg to place the quadratic regression
command on the home screen. Then press

 arrow right to select YVARS and select Function and then Y2 ENTER.
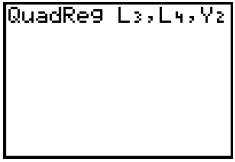
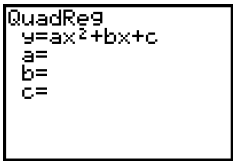
9. Copy the values that appear on your calculator screen
into the matching table to the right.
Are the values of a, b, and c in the quadratic regression equation above
consistent with your table values from question (7)?
______________________________________________________________________________
10. Press Y=, move the cursor onto the equal sign
for Y2 and press ENTER to turn on this equation. How well does it fit
with your data?
______________________________________________________________________________
______________________________________________________________________________
11. In your own words, describe how the constant a affects
the graph of

Specifically, how does the sign of A change the graph?
______________________________________________________________________________
______________________________________________________________________________
12. Suppose you had chosen the parabolic section for the
bounce just to the right of the one you actually used in this activity. Describe
how each of the constants A, B and C would have to change, if at all, in order
to fit this parabolic section with the equation .

______________________________________________________________________________
______________________________________________________________________________
______________________________________________________________________________
13. From your physics lessons, you learned that for
constant acceleration, the equation for motion is:
 .
How does this equation relate to the data that you collected? Relate each part
of the equation and each variable.
______________________________________________________________________________
______________________________________________________________________________
______________________________________________________________________________
14. From your data, what is the value of the acceleration due to gravity?________________
15. How close is this to the theoretical value? Find the percentage of error. Show your calculation.
16. Do the values of b and c from your regression equation
represent the initial velocity and initial position of the ball? Explain your
reasoning.
______________________________________________________________________________
______________________________________________________________________________

