Fitting a Quadratic Function to Data
Example: Problem #75 on page 273 from the text titled “College Algebra: Graphs & Models”, Third Edition, by Bittinger, Beecher, Ellenbogen, and Penna. Fit a quadratic Function to the Data shown in the table below. Let x represent the number of years since 1992.
| Year | Mortgage Debt (In Billions) |
| 1992 | $4254 |
| 1993 | 4209 |
| 1994 | 4381 |
| 1995 | 4577 |
| 1996 | 4865 |
| 1997 | 5203 |
| 1998 | 5723 |
| 1999 | 6360 |
| 2000 | 6887 |
| 2001 | 7596 |
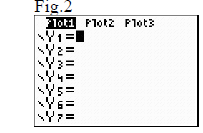
Before you begin make sure that the Plot1 is ON. Make sure that you clear out any functions that may be stored in the function editor. Your screens should look like the ones shown in Fig.1 and Fig.2. You might want to review the worksheet, Preparing the Calculator for Regression.


To begin, press  , choose
 for EDIT. Enter all the x-values in the L1
column and all the y-values in the L2 column using the same steps as you did
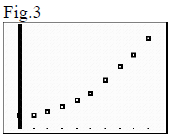
when fitting a linear function to data. Once all the data is entered, press
 Your screen should look like the one shown in
Fig.3.

Next, press  so that
your screen looks like the one shown in Fig.4. Select
 to get the screen shown in Fig.5. Press
 resulting in the screen shown in Fig.6. Press
 . Your screen will look like the one in
Fig.7. Press
  to see the screen in Fig.8.
Press
  , then
 again resulting in the screens shown in
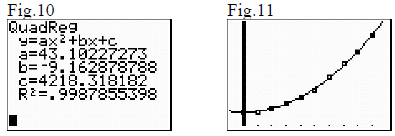
Fig.9 and Fig.10 respectively.


In Fig.10 you will see that a = 43.1, b = -9.2, and c =
4218.3, rounded to the nearest tenth. Press  to graph the quadratic function that you have calculated. The result is shown in
Fig. 11.
The quadratic function, f(x) = ax² + bx + c, that best fits the data is f(x) = 43.1x² - 9.2x + 4218.3.
Note: To find the cubic or quartic function that best fits a set of data you will follow the same procedure as for finding the quadratic function. When you get to the screen shown in Fig.4 you would select 6: CubicReg for the cubic function or choose 7: QuartReg for the quartic function.

