Sidebar Menu


Measures of Disease Frequency
Objectives
1.Differentiate rates, proportions and ratios
2.Compute prevalence and incidence rates
3.Define the different mortality rates and
years of potential life lost
4.Compute and differentiate crude, specific
and adjusted rates
5.Determine the uses for adjusted rates
6.Name the two methods of rate
adjustment
Introduction
• The most common form of organizing
epidemiologic information is through collecting
information about cases and non non-cases.
• The numbers are usually translated into rates.
• Rates indicate the risk of disease for a population.
• This helps to identify high
•high-risk groups and causal
•factors.
• Data elements collected from cases and non-
cases are called variables (age, sex, race,
weight, height, temperature, blood pressure,
disease, death etc)
Rates, Ratios and Proportions
• Variables or data elements are summarized to
provide number of cases, proportions, rates and
ratios = frequency
• In epidemiology many variables have only two
possible categories
• these are called dichotomous variables
• (e.g. disease or no disease; alive or dead).
• The frequency measures we use with
dichotomous variables are ratios, proportions
and rates.
• Ratio= the values of x and y may be completely
independent, or x may be included in y. For
example, the sex of children attending well baby
clinic (male to female).
• Proportion= x is included in y (female/all *10n)
i.e. Percent of females
• Rate= is a proportion with time dimension. It measures
the occurrence of an event in a population over time.
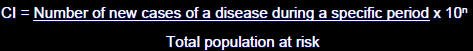
• Rate= number of cases or events occurring during a
given time period/ population at risk during the same
time period*10n
• Rate
is the measure of risk for disease with a time
components
• The persons in the denominator must reflect the
population from which the cases in the numerator
arose
• The counts in the numerator and denominator should
cover the same time period
• The person in the denominator must be at risk for the
event
• Once numerator is divided by denominator– the
quotient is multiplied by a factor to make it easier to
understand
Incidence Rate
• Incidence rate is the most common way of
measuring and comparing the frequency of
disease in populations.
•
Definition: incidence refers to the occurrence of
new cases in a population over a period of time.
• It estimates the risk of developing a disease in a
specified population during a specified period of
time.
Cumulative Incidence
There are two types of Incidence
rates:
1.Cumulative Incidence (CI):
is the proportion of people who become diseased during a specified
period of time.
• CI provides an estimate of the probability, or risk that
an individual will develop a disease during a specified
period of time.
• The time period must be clearly specified when
reporting the C
• The CI assumes
• That the entire population is at risk at
the beginning of the study period
• That the populations has been followed
for the specified time interval
• In 2000:
• 733,151 new cases of gonorrhea were
reported among the United States civilian
population.
• The mid
mid-year civilian population was
estimated to be 246,552,000.
CI=[733,151/246,552,000] x 1,000=2.97 per
1000 population.
Incidence Density
2. Incidence density (ID)= measure of risk in a changing
population where people are free of disease at start and
observed for onset of disease for different time periods
• Shows how rapidly cases develop
• In presenting an incidence density, it is essential to
specify the relevant time units – i.e. number of cases
per person person-day, person person-month, person person-year, etc.
•
Person-time is the number of persons at risk for disease
multiplied by the length of time they are observed for
onset of disease
Person years = # of person * # of years followed up
Example: In a cohort study, 600 contraceptive users were
followed over the course of three years as follows:
• 100 women for 1year
• 200 women for 2 years
• 300 women for 3 years
The number of person person-years of observation in this study is:
• 100 women x 1 = 100
person-years
• 200 women x 2 = 400
person-years
• 300 women x 3 = 900
person-years
Total= 1400 person person-years
• Of these 600 people
• 10 developed thromboembolism .
• The incidence rate of thromboembolism is
calculated as:
• 10/1400 = 7.1 per 1000 person years of follow
up.
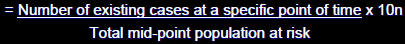
Prevalence Rate
• Is the proportion of persons in a population who
have a particular disease or attribute at a
specified point in time or over a specified period
of time
• Gives an indication of the
“burden burden” of disease in
a population - numerator is existing cases
• Usually expressed as a percentage i.e.,
multiplier = 100 and if the disease is rare it is
expressed as 10n
There are two types of prevalence:
1.Point prevalence: is the presence of a disease at a
single point in time (snap shot).
2. Period Prevalence:
the presence of a disease at a
particular time interval.

• Prevalence usually refers to point prevalence
RELATIONSHIP BETWEEN PREVALENCE AND
INCIDENCE
• Incidence– new cases
• Prevalence– all cases (existing and new)
• Prevalence and Incidence are related by average
duration (D) of disease in a stable population
• If a disease lasts a long time, there will be higher
prevalence in the population
• If incidence is low but those affected have the condition
for long = the prevalence will be high relative to the
incidence
• If disease is short short-lived, there will
be low prevalence in the population
• If incidence is high but the disease duration is short then
the prevalence will be low relative to the incidence
• Example: a follow up study of the Framingham
data showed males and females had same IR
for heart disease but females had a higher
prevalence of disease – WHY?
• PR = What proportion of the population has this
condition?
• IR = At what rate do new cases arise over time
in the population?
• Example: in Richmond City, 2006, there were a
total of 5,000 hepatitis B cases of which 1,000
were newly diagnosed.
• The total population of Richmond City is
200,000.
• Prevalence in 2006: 5,000/200,000*1000=25
per 1,000 population
• Incidence in 2006: 1,000/200,000* 1000=5
per 1,000 population
Uses of Prevalence and Incidence
Measures
• Prevalence is mostly used for planning,
evaluating
• Incidence is used to identify causal
relationships
Attack Rate
1)Attack Rate: Is a variant of an incidence rate,
applied to a narrowly defined population
observed for a limited time, such as during an
epidemic or outbreak of a disease. It is usually
expressed in %.
A measure of probability of risk.
| Attack Rates and Picnics |  |

Example: Of 75 persons who attended a church picnic, 46
subsequently developed gastroenteritis. The attack rate
of gastroenteritis is:
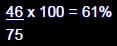
• The risk of developing gastroenteritis in this population
was 61%.
Secondary Attack Rate
2) Secondary attack rate: is a measure of
the frequency of new cases of a disease
among the contacts of known cases.

• Example:
• Seven
cases of hepatitis A occurred among 70 elderly
patients in an adult day care center.
• The total number of persons in the 7 affected families
were 32 .
• In several weeks,5 family members of the 7 infected
patients also developed hepatitis A.
• Calculate the attack rate and the secondary
attack rate among family contacts of those
cases.
• Cases of hepatitis A among the elderly = 7
• Number of elderly in the adult care center = 70
 Attack rate = 7/70 x 100 = 10%
• Cases of hepatitis A among family contacts = 5
Number of persons at risk in the families (total number of
family member with elderly already infected) = 32-7 = 25
• Secondary attack rate = 5/25 x 100 = 20%
Mortality Measures
• Crude Mortality Rate: is a measure of the frequency of
occurrence of death in a defined population during a
specified interval i.e. for a defined population over a
specified period of time
Crude 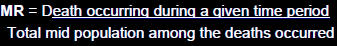 x10n
x10n
Example: In 2001, there were 12,000 deaths from all
causes among 2 million population of Atlanta, Georgia.
Crude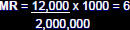 deaths per 1000 population per year
•Case Fatality Rate: is the proportion of persons with a
particular condition (cases) that die from the condition. It
is usually expressed in percent.
• Case Fatality Rate: 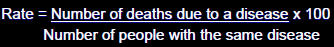
Example: in Richmond city, there were 500 cases of colon
cancer, of whom five died within a year after their initial
diagnosis. The case fatality rate for colon cancer in
Richmond city was:
5/500 x 100 = 1%
• Age-specific MR = is a mortality rate
limited to a particular age group.
• Infant Mortality
Rate: is one of the most commonly
used measures for comparing health service among
nations.
I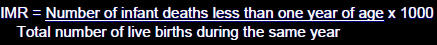
Example: Denver, Colorado, with a population of 2.37
million, reported a total of 270 infant deaths and 30,000
live births in 1981.
• IMR = 270/30,000 x 1000 = 9 infant deaths per 1000 live
births per year.
• Neonatal Mortality Rate: is defined as the
period from birth up to 28 days.

E.g. Memphis, Tennessee, with a population of 1.37
million, reported a total number of 150 neonatal deaths
and 30,000 live births in 1982.
NMR = 150/30,000 x 1000 = 5
Five neonatal deaths per 1000 live births per year.
• Post neonatal mortality rate: The post neonatal period
is defined as the period from 28 days of age up to but
not including 1 year of age.

• Example: In Oakland California there were 2 million
births in 1995, of which 10,000 died before they reach
their first birth day. 7,500 of the infant died within the
first 28 days. Calculate the IMR, NMR and PNMR
| • Live births | 2,000,000 |
| • Infant deaths | 10,000 |
| • Neonates | 7,500 |
| • Post Post-neonates |
2,500 = 10,000 10,000-7,500 |
IMR = 10,000/2,000,000 x 1,000 = 5 per 1,000 live births
NMR = 7,500/2,000,000 x 1000 = 4 per 1,000 live births
PNMR = 2,500/2,000,000 x 1000 = 1 per 1,000 live births
• Years of Potential Life Lost (YPLL)= measure of
premature death
• Premature death = when a death occurs earlier than
expected if disease were not present.
• YPLL == Years lost before age 75 years or set age
• Difference between age 75 years and the age of
death is calculated for each decedent in population
and summed
Adjusted Rates
• A statistically manipulated rate controlling for the factor
of interest (age, race, etc)
• Specific
rates give more valuable information when
comparing rates between sub sub-groups
However, specific rates do not provide accurate comparison
with other population.
• Adjusted rates
provide a summary statistic that
corrects for differences in age or other factors in
populations – making comparisons possible between
different populations
• The computational process for adjusted rate is called
“standardization standardization” or “adjustment adjustment”
• Advantages
• Provides summary statement
• Differences in groups removed to permit unbiased
comparisons
• Disadvantages
• Statistically manipulated rates (fictional)
• Absolute magnitude dependent on choice of reference
population
• Two methods of adjustment:
• 1) Direct
• 2) Indirect
• Direct Method is commonly utilized in
practice
• But is this necessarily the most accurate?

Adjusted Mortality Rates
 Example:
– You are a primary care practitioner in a suburb of a
medium medium-sized city.
– Some of your patients lately have been older men
with cardiac chest pain, and after appropriate testing
you have decided that several of them should
undergo coronary artery bypass surgery.
– There are 2 groups of surgeons and you want to send
your patients to the group with lowest mortality rate.
Direct Comparison of Mortality Rate
| Age Group | Clinic A | Clinic B | ||||||
| Surgeries | Operative Deaths | Operative Mortality | Surgeries | Operative Deaths | Operative Mortality | |||
| 45-54 | 500 | 6 | 1.2% | 300 | 3 | 1% | ||
| 55-64 | 300 | 15 | 5% | 300 | 12 | 4% | ||
| 65-74 | 200 | 20 | 10% | 400 | 36 | 9% | ||
| Total 45-74 | 1000 | 41 | 4.1% | 1000 | 51 | 5.1% | ||
• Step 1:Calculate age age-specific rates in the populations
you want to compare
| Age Group | Clinic A | Clinic B | ||||||
| Surgeries | Operative Deaths | Operative Mortality | Surgeries | Operative Deaths | Operative Mortality | |||
| 45-54 | 500 | 6 | 1.2% | 300 | 3 | 1% | ||
| 55-64 | 300 | 15 | 5% | 300 | 12 | 4% | ||
| 65-74 | 200 | 20 | 10% | 400 | 36 | 9% | ||
| Total 45-74 | 1000 | 41 | 4.1% | 1000 | 51 | 5.1% | ||
• Step 2: Choose a reference population whose
: age composition is known.
• US 2000 standard population
• 45-54 years 134,834
• 55-64 years 87,247
• 65-74 years 66,037
• Step 3:Calculate Expected deaths in
reference population if the Clinic A A- or
Clinic B B-specific rates were the true rates
| Age Group | No. in ref pop (1) | Operative Mortality | Expected # of deaths in ref pop using rates from |
||||
| Clinic A (2) |
Clinic B (3) |
Clinic A (1)x(2) |
Clinic B (1)x(3) |
||||
| 45-54 | 134,834 | 1.20% | 1.00% | 1618.0 | 1348.3 | ||
| 55-64 | 87,247 | 5.00% | 4.00% | ||||
| 65-74 | 66,037 | 10.00% | 9.00% | ||||
| Total | 288,118 | 12,584.1 | |||||
• Step 4. Add up the total number of deaths expected in
. the reference population under each clinic's set of rates.
| Age Group | No. in ref pop (1) | Operative Mortality | Expected # of deaths in ref pop using rates from |
||||
| Clinic A (2) |
Clinic B (3) |
Clinic A (1)x(2) |
Clinic B (1)x(3) |
||||
| 45-54 | 134,834 | 1.20% | 1.00% | 1618.0 | 1348.3 | ||
| 55-64 | 87,247 | 5.00% | 4.00% | 4362.35 | 3489.88 | ||
| 65-74 | 66,037 | 10.00% | 9.00% | 6603.70 | 5943.33 | ||
| Total | 288,118 | 12,584.1 | 10,781.5 | ||||
• Step 5. Calculate the age . age-adjusted operative
mortality rate for each study group by dividing
the sum of expected deaths by the total size of
the reference population:

• Clinic A:12,584.1 / 288,118 * 100 =
• 4.37 / 100 surgeries
• Clinic B:10,781.5 / 288,118 * 100 =
• 3.74 / 100 surgeries
• Which clinic would you recommend
now?