Exploring Quadratic Graphs
NC State Standard:
Algebra 4.02; Integrated Math 4.02
Objectives:
1. Students will explore and develop understanding of quadratic functions.
2. Students will understand how changing ‘a’, and ‘c’ of the equation
y = ax2 + bx + c changes the graph.
3. Students will become familiar with vocabulary associated with quadratic
equations.
Launch:
Warm‐up. On overhead.
On your graphing calculator please graph the following equations. Set your
window
to Xmin = ‐10, Xmax = 10, Ymin = ‐10, and Ymax = 10.
y = x
y = x2
Draw a sketch of the equations and using sentences explain the similarities
between
these two equations and the differences. Please use math terms that we have
learned such as linear and non‐linear.
Transition:
Review observations that the students had. Discuss how adding an exponent made
the graph non‐linear. After discussion and observations are complete, go over
objective for the day.
Notes:
1. Quadratic function: a function that can be written in the form y = ax2 + bx +
c,
where a ≠ 0.
Examples:
a. y = 5x2
b. y = x2+ 4
c. y = 7x2+ 3x +1
2. Parabola: the graph of a quadratic function. It is a U‐shaped curve.
Examples: (graphed by hand and on calculator)

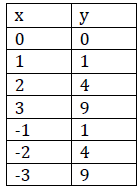

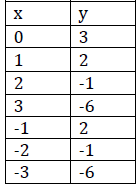
3. Vertex: highest or lowest point of parabola (bottom on
U shape) (label on
above graphs)
a. Minimum: the vertex when the parabola opens up.
b. Maximum: the vertex when the parabola opens down.
4. Questions?
Partner Activity: Discovering the quadratic function.
Students will work in partners to practice graphing quadratic functions by hand
and
on the calculator. Students will discover how the graph changes when ‘a’ and ‘c’
change.
Individual Work:
Students will write an essay summarizing what they learned from the partner
activity and what we learned in class today. This essay should include all the
vocabulary from today’s lesson. Questions to guide summaries are at the bottom
of
investigation worksheet. Rationale: Students need to practice with vocabulary
and
math discussion. This is a good opportunity for students to practice writing in
math.
Closing:
Quick review. Students will indicate the direction the parabola will open
according
to the ‘a’ term being negative or positive. Then we will switch to point in
which
direction the parabola will move (up or down) from y = x2 according to the c
term
that is added.
Your
name:_________________________________________________________
Partner’s name:_____________________________________________________________
In this lab you will discover how the shape of a quadratic equation changes when
the coefficients ‘a’ and ‘c’ change. Your goals in this lab are to discover
patterns and
trends. After this lab you will be responsible for writing a summary of your
results
so make sure you discuss parts that you do not understand with your partner.
Part I. The ‘a’ Coefficient.
Before you use the calculator lets make sure you can create these graphs by
hand.
1. Graph y = x2. Show the values of x you picked and the corresponding y value.
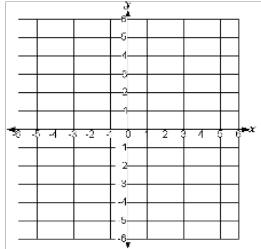
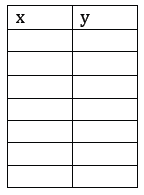
Now you may use your graphing calculator.
2. Graph y = ‐x2.
3. What are the differences between the two graphs from
question 1 and 2?
4. Remember that there is a 1 in front of x2 and a ‐1 in front of –x2 which
correspond to the a coefficient in the quadratic function. Try graphing the
following functions.


5. What kind of statement can you make about how the graph
changes
according to whether the ‘a’ coefficient is positive or negative?
6. When the ‘a’ term is negative, is the vertex the minimum point or the
maximum point?
7. Graph the following on your calculator at the same
time. Label which graph
is which equation in your sketch.

8. What do you notice about the width of the parabola as
the ‘a’ term changes?
If you are not sure try a few more examples.
9. Which would make a wider parabola y = 5x2 or y = 2x2? _______________________
Why?
Part II. The ‘c’ or constant coefficient.
10. Graph y = x2 , y = x2 + 1 on the same graph. Label each equation on the
graph
that you sketch.
11. What happened to y = x2 when it became y = x2+1?
12. Now graph y = x2 and y = x2 ‐ 2. Which direction did the constant term ‐2
move the vertex of the parabola?
13. Which vertex would be higher, the vertex on y = x2 + 5 or y = x2 + 6? Why?
14. How does the constant term move the parabola? Describe what positive
and negative values of ‘c’ do to the position of the vertex.
Part III. Practice.
15. Do p. 514 in your textbook problems 21 – 30.
Summary Assignment:
The following questions are to help guide your summary of
today’s lesson. You are
not supposed to simply answer these questions, but use these as a guide to write
one to two paragraphs about today’s lesson. Please remember that writing is an
important part of math and I expect proper punctuation and good sentences.
1. What does the graph of a quadratic function look like? What do we call it?
2. What happens to the graph as the ‘a’ coefficient changes from positive to
a negative? Talk about the vertex being a maximum or a minimum.
3. What happens to the graph with larger numbers as the ‘a’ coefficient?
Smaller numbers?
4. What happens to the graph as a constant term is added? How does the
graph move? How does the vertex move?

