Sidebar Menu


Graphs and Functions
3.1 Graphs
3.1.1 The Cartesian Coordinate System
Definition 1. Cartesian Coordinate System - (or Rectangular coordinate
system) consists of
two number lines in a plane drawn perpendicular to each other.
x-axis - the horizontal axis is called the x-axis.
y-axis - the vertical axis is called the y-axis.
Origin - the point of intersection of the two axes is called the origin.
On the coordinate system we will be plotting points. To describe the points
in this coordinate
system we use and ordered pair of numbers (x, y). The two numbers, x and y are
called the
x-coordinate and y-coordinate respectively.
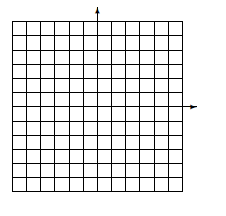
EX 1. Plot the following points on the same set of axes:
A(2, 3) B(0,1) C(-5, 0) D(-2, -1) E(3,-2)
3.1.2 Graphs
Definition 2. The graph of an equation is an illustration of the set of
points whose coordinates
satisfy the equation.
EX 2. -
1. Determine whether the following ordered pairs are solutions of the equation y
= -2x + 5.
(a) (1, 3) (b) (2, 3)
2. Graph y = 2x.
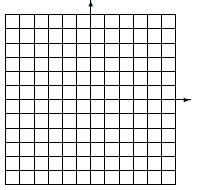
3. Graph y = 1/2x + 3.
REMARK 1. For the graphs above:
•The above graphs are called linear because they are straight lines.
•Any equation whose graph is a straight line is called a linear equation.
•They are also called first degree equations because the highest exponent on any of
the
variables is 1.
3.1.3 Nonlinear Graphs
Equations whose graphs are not straight lines are called nonlinear equations.
The key to graphing
nonlinear equations is to be sure to plot enough points so we can be sure of
what it will look like.
EX 3. -
1. Graph y = x2-1.
2. Graph y = 2/x .
3. Graph y = |x| + 1.
3.2 Functions
The concept of a function is one of the most important in all of mathematics. We
will discuss several
ways of thinking about and defining functions. But first:
EX 4. Suppose you are driving your car at a constant 40 mph. Can we
find a correspondence
between the number of hours driven with the distance travelled?
Definition 3. We have the following terminology:
•The set of all possible times driven is called the domain.
•The set of all possible distances travelled is called the range
EX 5. We have the following schematic:
Definition 4. A function is a correspondence between the
first set of
elements, the domain, and
a second set of elements, the range, such that each element of the domain
corresponds to exactly
one element in the range.
EX 6. Consider the following.
1. (Blackboard)
2. (Blackboard)
3. Consider children and biological mothers. The correspondence of children
to biological mothers
is a function since for each child there is only one biological mother. However
the correspon-
dence between biological mothers to children is not a function, since one
biological mother
could have multiple children.
An Alternate Definition
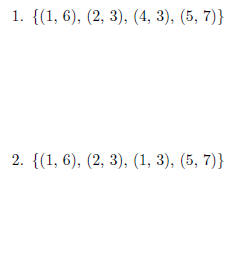
Definition 5. A function is a set of ordered pairs in which no
first
coordinate is repeated.
EX 7. Determine whether the following are functions:
3.2.1 The Vertical Line Test
Most of our functions we will have a domain and range that is either the real
numbers or a subset
of the real numbers. For such functions we can graph them on the cartesian
coordinate system.
The graph of a function is the graph of its set of ordered pairs.
The vertical line test: If a vertical line can be drawn through any part of the
graph and the
line intersects another part of the graph, the graph does not represent a
function. If a vertical line
cannot be drawn to intersect the graph at more than one point, the graph
represents a function.
Stated more simply: if, on the graph of a function, we can draw a line that
intersects at more
than one point, it is not a function. If we can't, it is a function.
EX 8. Determine whether the following are functions:
1. Consider the following graphs:
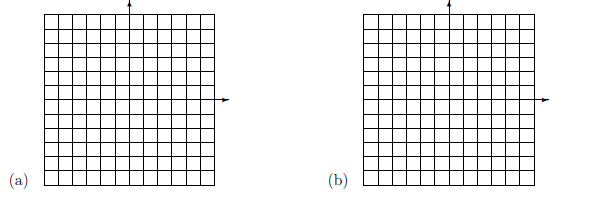
2. Use the vertical line test to determine whether the following graphs
represent functions. Also
determine the domain and range of each function or relation.
3. Critical thinking: Consider the graph (drawn on blackboard) which
represents the speed versus
time of a student driving to school in the morning. Describe what might be
occuring for this
function.
3.2.2 Function Notation
Many of the equations we graphed in sections 3.1 were functions. See examples 2
and 3 from section
3.1. We notice that each of them passes the vertical line test. What are the
domain and range of
each of them?
In this class, most of the equations we will encounter will be functions. When
an equation is
written in terms of x and y we will frequently wrtie the equation in function
notation
f(x) read as "f of x"
Warning: This is NOT multiplication.
EX 9. Let's consider the equation y = 2x + 1
•Notice that the value of y depends on x.
•If we plug in a value for x we get a value for y, different values of x give
different values of x.
•We say that y is a function of x.
•In this case, we can substitute f(x) for y. This tells us what the independent
variable is. It
explicitly states that the value depends on x.
•Our function becomes f(x) = 2x + 1
•We will use both notations interchangeably.
REMARK 2. We don't always us the letter f. Sometimes we use
different
letters for both our
function and our independent variable. For example g(x), h(x), P(t), etc. . .
EX 10. We also will evaluate functions with this notation.
1. If f(x) = 3x2-5x + 1 find
(a) f(4) (b) f(a)
2. Determine each function value:

3. An application: The Celsius temperature, C, is a function of the Fahrenheit temperature, F.
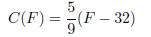
Determine the Celsius temperature that corresponds to 131ºF