Quadratic Functions
Section 2.1 Quadratic Functions
Objective: In this lesson you learned how to sketch and analyze graphs
of quadratic functions.
Important Vocabulary Define each term or concept.
Constant function A polynomial function with degree 0. That is, f(x) =
a, a ≠ 0.
Linear function A polynomial function with degree 1. That is, f(x) = mx + b, m ≠
0.
Quadratic function Let a, b, and c be real numbers with a ≠ 0. The
function f(x) =
ax2 + bx + c is called a quadratic function.
Axis of symmetry A line about which a parabola is symmetric. Also called
simply
the axis of the parabola.
Vertex The point where the axis intersects the parabola.
I. The Graph of a Quadratic Function (Pages 136-138)
Let n be a nonnegative integer and let  be
be
real numbers with  A polynomial function of x
with
degree n is . . .
the function 
What you should learn
How to analyze graphs of
quadratic functions
A quadratic function is a polynomial function of second
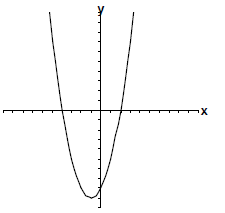
degree. The graph of a quadratic function is a special “U”-shaped
curve called a parabola .
If the leading coefficient of a quadratic function is positive, the
graph of the function opens upward and the vertex of
the parabola is the minimum point on the graph. If the
leading coefficient of a quadratic function is negative, the graph
of the function opens downward and the vertex of the
parabola is the maximum point on the graph.
II. The Standard Form of a Quadratic Function
(Pages 139-140)
The standard form of a quadratic function is

For a quadratic function in standard form, the axis of the
associated parabola is x = h and the vertex is
(h, k) .
What you should learn
How to write quadratic
functions in standard
form and use the results
to sketch graphs of
functions
To write a quadratic function in standard form , . . . use the
process of completing the square on the variable x.
To find the x-intercepts of the graph of f (x) = ax2 + bx + c , . . .
solve the equation ax2 + bx + c = 0.
Example 1: Sketch the graph of f (x) = x2 + 2x - 8 and
identify the vertex, axis, and x-intercepts of the
parabola.
(- 1, - 9); x = - 1; (- 4, 0) and (2, 0)

III. Applications (Pages 141-142)
For a quadratic function in the form f (x) = ax2 + bx + c , when
a > 0, f has a minimum that occurs at - b/(2a) .
When a < 0, f has a maximum that occurs at - b/(2a) .
To find the minimum or maximum value, evaluate the
function at - b/(2a) .
What you should learn
How to use quadratic
functions to model and
solve real-life problems
Example 2: Find the minimum value of the function
f (x) = 3x2 -11x +16 . At what value of x does
this minimum occur?
Minimum function value is 71/12 when x = 11/6
Homework Assignment
Page(s)
Exercises

