| |
Number Sense
 Students
compare and order positive and negative fractions, decimals, and Students
compare and order positive and negative fractions, decimals, and
mixed numbers. Students solve problems involving fractions, ratios,
proportions,
and percentages:
 Compare and
order positive and negative fractions, decimals, and mixed Compare and
order positive and negative fractions, decimals, and mixed
numbers and place them on a number line.
 Interpret and
use ratios in different contexts (e.g., batting averages, miles per Interpret and
use ratios in different contexts (e.g., batting averages, miles per
hour) to show the relative sizes of two quantities, using appropriate
notations
(a/b, a to b, a:b).
Write the following as ratios:
1. The ratio of tricycles to tricycle wheels
2. The ratio of hands to fingers
3. If there are 6 tricycle wheels, how many tricycles are there?
4. If there are 45 fingers, how many hands are there?
 Use
proportions to solve problems (e.g., determine the value of N if Use
proportions to solve problems (e.g., determine the value of N if
4/7 = N/21, find the length of a side of a polygon similar to a known
polygon). Use cross-multiplication as a method for solving such
problems,
understanding it as the multiplication of both sides of an equation by a
multiplicative inverse.
Find n if:
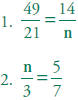
(This problem also applies to Algebra and
Functions Standard 1.1.)
 Calculate
given percentages of quantities and solve problems involving Calculate
given percentages of quantities and solve problems involving
discounts at sales, interest earned, and tips.
 Students
calculate and solve problems involving addition, subtraction, Students
calculate and solve problems involving addition, subtraction,
multiplication, and division:
2.1 Solve problems involving addition,
subtraction, multiplication, and division
of positive fractions and explain why a particular operation was used
for a
given situation.
2.2 Explain the meaning of multiplication and division of positive
fractions and
perform the calculations 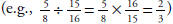
1. If 11/7 is divided by a certain fraction
a/b, the result is 3/8. What is a/b?
2. Draw a rectangle that has a perimeter of 1 and an area of less than
1/30.
 Solve
addition, subtraction, multiplication, and division problems, including Solve
addition, subtraction, multiplication, and division problems, including
those arising in concrete situations, that use positive and negative
integers
and combinations of these operations.
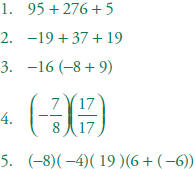
Simplify to make the calculation as simple as
possible and identify the
properties you used at each step:
 Determine the
least common multiple and the greatest common divisor of Determine the
least common multiple and the greatest common divisor of
whole numbers; use them to solve problems with fractions (e.g., to find
a
common denominator to add two fractions or to find the reduced form for
a
fraction).
|
Note: The sample
problems illustrate
the standards and
are written to help
clarify them. Some
problems are written
in a form that can be
used directly with
students; others will
need to be modified,
particularly in the
primary grades,
before they are
used with students.The symbol

identifies the key
standards for
grade six.
|
| |
Algebra and Functions
1.0 Students write verbal expressions and sentences as algebraic
expressions and
equations; they evaluate algebraic expressions, solve simple linear
equations,
and graph and interpret their results:
Write and
solve one-step linear equations in one variable.
6y - 2 = 10. What is y?
1.2 Write and evaluate an algebraic expression for
a given situation, using up to
three variables.
Joe’s sister Mary is twice as old as he is. Mary is 16. How old is Joe?
1.3 Apply algebraic order of operations and the commutative,
associative, and
distributive properties to evaluate expressions; and justify each step
in the
process.
1.4 Solve problems manually by using the correct order of operations or
by using
a scientific calculator.
2.0 Students analyze and use tables, graphs, and rules to solve
problems involving
rates and proportions:
2.1 Convert one unit of measurement to another (e.g., from feet to
miles, from
centimeters to inches).
Suppose that one British pound is worth $1.50. In London a magazine
costs
3 pounds. In San Francisco the same magazine costs $4.25. In which city
is
the magazine cheaper?
When temperature is measured in both Celsius (C) and Fahrenheit (F),
it is known that they are related by the following formula:
9 × C = (F - 32) × 5.
What is 50 degrees Fahrenheit in Celsius? (Note the explicit use of
parentheses.)
 Demonstrate an
understanding that rate is a measure of one quantity per Demonstrate an
understanding that rate is a measure of one quantity per
unit value of another quantity.
Joe can type 9 words in 8 seconds. At this
rate, how many words can he type
in 2 minutes?
2.3 Solve problems involving rates, average speed, distance, and time.
Marcus took a train from San Francisco to San Jose, a distance of
54 miles. The train took 45 minutes for the trip. What was the average
speed of the train?
3.0 Students investigate geometric patterns and
describe them algebraically:
3.1 Use variables in expressions describing geometric quantities
(e.g., P = 2w + 2l, A = 1/2 bh, C =π d—the formulas for the
perimeter
of a rectangle, the area of a triangle, and the circumference of a
circle, respectively).
A rectangle has width w. Its length is one more than 3 times its
width. Find
the perimeter of the rectangle. (Your answer will be expressed in terms
of w.)
3.2 Express in symbolic form simple relationships arising from geometry.
|
|
| |
Statistics, Data Analysis, and Probability
1.0 Students compute and analyze statistical measurements for data sets:
1.1 Compute the range, mean, median, and mode of data sets.
1.2 Understand how additional data added to data sets may affect these
computations
of measures of central tendency.
1.3 Understand how the inclusion or exclusion of outliers affects
measures of
central tendency.
1.4 Know why a specific measure of central tendency (mean, median, mode)
provides the most useful information in a given context.
2.0 Students use data samples of a population and describe the
characteristics
and limitations of the samples:
2.1 Compare different samples of a population with the data from the
entire
population and identify a situation in which it makes sense to use a
sample.
Identify
different ways of selecting a sample (e.g., convenience sampling,
responses to a survey, random sampling) and which method makes a sample
more representative for a population.
Analyze data
displays and explain why the way in which the question was
asked might have influenced the results obtained and why the way in
which
the results were displayed might have influenced the conclusions
reached.
Identify data
that represent sampling errors and explain why the sample (and
the display) might be biased.
 Identify
claims based on statistical data and, in simple cases, evaluate the Identify
claims based on statistical data and, in simple cases, evaluate the
validity of the claims.
3.0 Students determine theoretical and
experimental probabilities and use these
to make predictions about events:
 Represent all
possible outcomes for compound events in an organized way Represent all
possible outcomes for compound events in an organized way
(e.g., tables, grids, tree diagrams) and express the theoretical
probability of
each outcome.
3.2 Use data to estimate the probability of future
events (e.g., batting averages or
number of accidents per mile driven).
 Represent
probabilities as ratios, proportions, decimals between 0 and 1, and Represent
probabilities as ratios, proportions, decimals between 0 and 1, and
percentages between 0 and 100 and verify that the probabilities computed
are reasonable; know that if P is the probability of an event, 1-P is
the
probability of an event not occurring.
3.4 Understand that the probability of either of two disjoint events
occurring is
the sum of the two individual probabilities and that the probability of
one
event following another, in independent trials, is the product of the
two
probabilities.
Understand the difference between independent and dependent events.
|
|
| |
Mathematical Reasoning
1.0 Students make decisions about how to approach problems:
1.1 Analyze problems by identifying relationships, distinguishing
relevant from
irrelevant information, identifying missing information, sequencing and
prioritizing information, and observing patterns.
1.2 Formulate and justify mathematical conjectures based on a general
description
of the mathematical question or problem posed.
1.3 Determine when and how to break a problem into simpler parts.
2.0 Students use strategies, skills, and concepts
in finding solutions:
2.1 Use estimation to verify the reasonableness of calculated results.
2.2 Apply strategies and results from simpler problems to more complex
problems.
2.3 Estimate unknown quantities graphically and solve for them by using
logical reasoning and arithmetic and algebraic techniques.
2.4 Use a variety of methods, such as words, numbers, symbols, charts,
graphs,
tables, diagrams, and models, to explain mathematical reasoning.
2.5 Express the solution clearly and logically by using the appropriate
mathematical
notation and terms and clear language; support solutions with
evidence in both verbal and symbolic work.
2.6 Indicate the relative advantages of exact and approximate solutions
to
problems and give answers to a specified degree of accuracy.
2.7 Make precise calculations and check the validity of the results from
the
context of the problem.
3.0 Students move beyond a particular problem by generalizing to
other
situations:
3.1 Evaluate the reasonableness of the solution in the context of the
original
situation.
3.2 Note the method of deriving the solution and demonstrate a
conceptual
understanding of the derivation by solving similar problems.
3.3 Develop generalizations of the results obtained and the strategies
used and
apply them in new problem situations. |
|