Sidebar Menu


Probability and Expected Value
Goal: The goal of this lesson is to introduce
students to the methods and ideas behind
probability theory.
Theoretical Probability
Students will learn how to find all the possible outcomes of a trial, including
repeated outcomes, which are often overlooked. In order to do this, they will
make
a tree diagram and learn how to make an area model. Once they have determined
the possible outcomes, they will compute theoretical probabilities.
Expected Value
Students will make predictions about an experiment based on the theoretical
probabilities they found.
Experimental Probability
Finally, students will perform an experiment and calculate the experimental
probabilities. They will compare these experimental probabilities with the
theoretical probabilities they found earlier, and they will compare the results
of the
experiment with the expected results
Grade and Course: 7th grade math
KY Standards:
MA-07-4.4.1
Students will apply counting techniques to determine the size of a sample space
for a realworld
or mathematical situation.
MA-07-4.4.2
Students will:
• determine theoretical probabilities of simple events
• determine probabilities based on the results of an experiment and
• make inferences from probability data.
MA-07-4.4.3
Students will tabulate experimental results from simulations and explain how
theoretical
and experimental probabilities are related.
Objectives:
After this lesson students will be able to:
o Differentiate between a theoretical and an experimental probability.
o Draw a tree diagram to find the possible outcomes of a trial.
o Draw an area model to find the possible outcomes of a trial.
o Compute theoretical probabilities.
o Make inferences based on theoretical probabilities.
o Compute experimental probabilities.
Resources/materials needed:
o One quarter
o 1 whiteboard, blackboard, or overhead projector
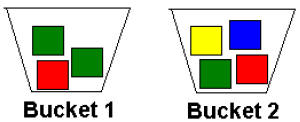
o 2 buckets or bags per group, labeled “Bucket 1” and “Bucket 2”
o 1 copy of worksheet per group (attached at end of document)
o 2 red, 1 yellow, 1 blue, and 3 green blocks per group, arranged as follows:
Description of Plan:
Prior Knowledge
Before this lesson, students know that the probability of an event is the number
of ways
that event can happen, divided by the total number of possible outcomes. They
are
familiar with reducing fractions.
Introduction to Class
When students enter the classroom, the buckets with the cubes in them are
sitting in the
front of the room to capture the students’ curiosity. The lesson begins with a
series of
class discussion questions intended to get the students thinking. For example:
- What are some carnival games that involve probability?
- What games could we play by flipping this quarter?
- What games could we play with the color cubes in these buckets? (Hold
up Bucket 1 and Bucket 2.)
Tell the class that today they are learning about probabilities that can be used
in games
just like the ones they discussed and elsewhere, and they are going to get the
opportunity
to perform two experiments, one with a quarter and one with the color cubes.
Introduction to Activity 1 (Coin Flip)
Define THEORETICAL PROBABILITY and EXPERIMENTAL PROBABILITY in
writing on the board. If the students usually keep their definitions in the same
place, have
them write it there. Talk about what the word theoretical sounds like (theory).
Talk
about what word experimental sounds like (experiment). Give a couple examples of
each
type of probability and have the students decide whether they are experimental
or
theoretical.
Now propose the following situation to the students: We flip a coin twice. How
many
possible outcomes are there? What are they? Write them on the board:
Possible Outcomes: 2 Heads, 2 Tails, A Head and a Tail
Ask the students, What is the probability of each outcome? (Students will
probably say
1/3.) Explain to the students that 1/3 is not the correct probability in any of
the three
cases. It seems to make sense, but there is a problem. Sometimes there are
hidden
outcomes that are repeated, and when dealing with probability, one must be
careful to
count ALL possible outcomes using a counting technique.
Activity 1 (Coin Flip) Procedure
Show the students how to make a factor tree to list all the possible outcomes of
flipping a
coin twice on the board:
List the possible outcomes: HH, HT, TH, TT
Now introduce the notation “P(event)” which means “the probability of an event.”
Find
P(HH), P(TT), P(HT), and P(HT) on the board as a class. Discuss how these
probabilities were found. Also find P(coins match) and P(coins do not match).
Ask the class, Are these probabilities theoretical or experimental? Why?
Announce to the students, "We are going to do our own experiment. I have a
quarter, and
each person in the class is going to flip it twice. We are going to be divided
into two
teams like so (girls vs. boys, left half vs. right half, etc.). Each time
someone on your
team gets a match (two heads or two tails), your team gets a point. If the two
flips do not
match, you get no point. The team with the most points wins. Since there are ___
students in the classroom, how many people do you expect to get a match? Not a
match?
How many people do you expect to get HH? TT? HT? TH?" (Write all of the expected
values on the board and how the students calculated them. Dwell on this subject
for a
while and make sure students understand where the expected values come from.)
At this point, go around the room and have each student
flip the quarter twice. Have
someone at the board record each student's outcome under that student's team
name. If
pressed for time, all students can flip a penny twice at the same time, but
going around
the room slowly builds anticipation and gives the students a break in this long
lesson.
When the game is done, congratulate the winners, console the losers, and have
the
students calculate the experimental probabilities of HH, HT, TH, TT, Match, and
No
Match on their own paper using all of the data, not just their team's data. Make
sure they
use the notation "P(HH) = ___" rather than just writing down the answer. Have
them
write a sentence comparing the theoretical probabilities to the experimental
probabilities.
Were they the same? Were they different? In what way?
Before transitioning to the next activity, discuss why just using an individual
team's data
would be less reliable than using the entire classroom's data if you were
interested in
estimating the theoretical probability.
Introduction to Activity 2 (Drawing Blocks)
Tell the class that the next activity will involve the buckets of color cubes
that the class
talked about earlier. Pose the following questions:
- If you close your eyes and draw a cube from Bucket 1, what is the
probability of drawing the red cube? A green cube?
- Now imagine that you close your eyes and draw one cube from Bucket 1
and one cube from Bucket 2. What is the probability of drawing a green
and a yellow? Why do you think that?
The concept of an area model is introduced. A square is drawn on the board or
overhead,
labeled “Bucket 1,” and cut into three equal pieces. One third is labeled “R,”
and the
other two are labeled “G.” This area model represents Bucket 1. Since there is a
1/3
chance of drawing a red from Bucket 1, “R” gets 1/3 of the area model. Since
there is a
2/3 chance of drawing a green from Bucket 1, “G” gets 2/3 of the area model. It
should
look like this:
Bucket 1