Sidebar Menu


Math Homework 1 Solutions
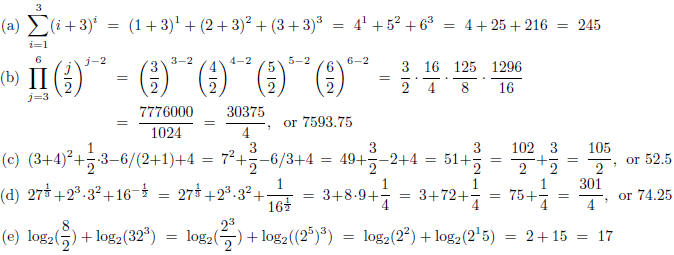
1. Find: 

| Solution |
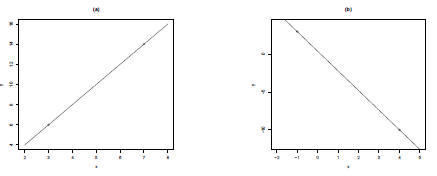
2. Plot the following pairs of points and find the corresponding line equations:
(a) (3,6); (7,14)
(b) (-1,3); (4,-10)
| Solution |
The following plots shows the points and the corresponding line for (a) and (b).
(a) We will use the equation for a line, y = mx + b. First we find the slope, m.
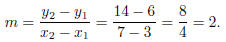
We plug m = 2 into the equation y = mx + b and get y = 2 ·
x + b = 2x + b.
To find b we will plug in x = 3 and y = 6 from the point (3,6) and solve for b.
y = 2x + b
6 = 2 · 3 + b
6 = 6 + b  (subtract 6 from each side)
0 = b.
Plugging b = 0 into y = 2x + b we get that the equation of the line is y = 2x + 0, or y = 2x.
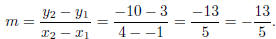
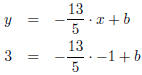
(b) We will use the equation for a line, y = mx + b. First we find the slope, m.
We plug  into the
equation y = mx + b and get
into the
equation y = mx + b and get  .
.
To find b we will plug in x = -1 and y = 3 from the point (-1,3) and solve for
b.
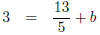 (subtract
  from each side)

Plugging  into
we get that the equation of the line is
into
we get that the equation of the line is
 , or
, or
y = -2.6x + .4.
3. Solve the following equations for their roots:

| Solution |
(a) To solve this, we want to get x by itself.
4x + 8 = 0 (subtract 8 from each side)
4x = -8 (divide each side by 4)
x = -2
(b) To solve this, we want to get x by itself.
-3x + 1 = 5 (subtract 1 from each side)
-3x = 4 (divide each side by -3)

(c) To solve this we will use the quadratic formula. If
our equation is in the from ax2 + bx + c = 0,
then our solution(s) are
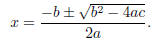
In this case a = 1, b = 4, and c = -5.
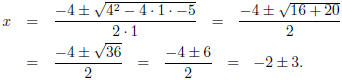
So x = -5 and x = 1.
(d) Again we will use the quadratic formula. Notice that
we want our equation in the form
ax2 +bx+ c = 0, so we first subtract 3 from both sides of the
equation to get that we are solving
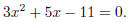
Plugging into the quadratic formula with a = 3, b = 5, and c = -11, we get
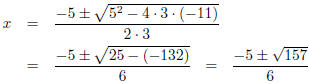
So 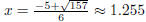 and
and
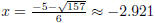 .
.
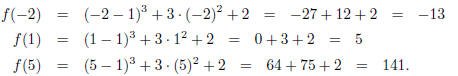
4. Find the Domain and Range for each function (Graph first);
Evaluate each function (if you can) at x = -2,1,5.

| Solution |
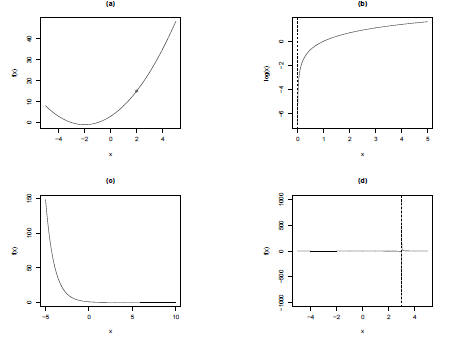
The following graphs show the functions for (a), (b), and (c).
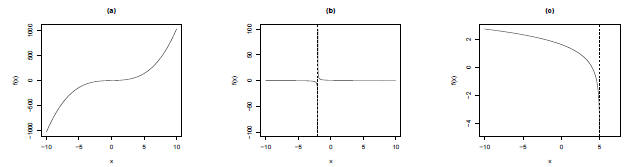
(a) The domain of this function is (-∞,∞) (all real
numbers). The range is also [-∞,∞). We can
evaluate at x = -2, 1, 5 by plugging in for x.
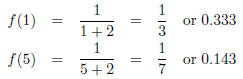
(b) The domain of this function is (-∞,-2) and (-2,∞) (all
real numbers except -2). The range
is (-∞, 0) and (0,∞) (all real numbers except 0). We can evaluate at x = 1, 5 (x
= -2 is not in
the domain) by plugging in for x.
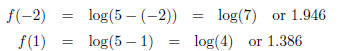
(c) The domain of this function is (-∞, 5) (all real
numbers less than 5). The range is (-∞,∞) (all
real numbers). We can evaluate at x = -2, 1 (x = 5 is not in the domain) by
plugging in for x.
5. For each f(x), write down a simpler function and how it was transformed. Graph f(x).

| Solution |
Graphs of the functions are shown below. In each case, the
function f(x) is the solid
line, while the simpler function g(x) is the dashed line.
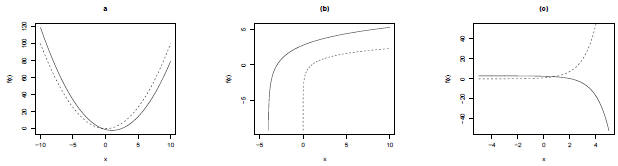
(a) A simpler function is g(x) = x2. The
function f(x) is the function g(x) shifted right by 1 unit and
down by 2 units.
(b) A simpler function is g(x) = log(x). The function f(x) is the function g(x)
shifted left by 4 units
and stretched vertically by a factor of 2.
(c) A simpler function is g(x) = ex. The function f(x) is the
function g(x) shifted right by 1 unit, up by
3 units, and then reflected about the x-axis.
6. Find the limit of each function:

| Solution |
In each case, we will be looking at plots of the function. These are shown below.
(a) Look at a plot of f(x) = x2 + 4x + 3 at x =
2 (see plot (a) above). The plot is continuous and finite
at x = 2, so the limit is simply f(2). That is,

(b) Look at a plot of f(x) = log x at x = 0 (see plot (b)
above). From the plot, it looks like as x is
getting closer to 0, the function is going off to -∞. So our limit is
(c) Look at a plot of f(x) = e-x as x → ∞
(see plot (c) above). That is, examine the plot as x gets
really large. From the plot it look like as x is getting large, the function is
getting closer and closer
to zero. So our limit is

(d) Look at a plot of  as x
as x  3 (see plot (d) above). That is,
examine the plot as x gets close
3 (see plot (d) above). That is,
examine the plot as x gets close
to 3 coming from the right-hand side. From the plot it look like as x gets close
to 3 from the right,
the function is getting larger and larger. So our limit is
7. A population starts at 50 at time t = 0. The suggested
population model is  , where t
is in years.
(a) What will the population be in 2 years?
(b) How long will it take for the population to reach 125?
(c) What is the limit of P(t) as t → ∞?
| Solution |
(a) Here we just want to evaluate P(2).
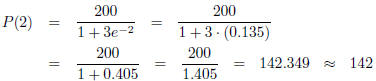 individuals.
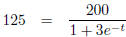
(b) Now we want to find t such that P(t) = 125. So we
solve  for t.
 (multiply each side by 1 + 3e-t)
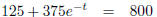 (subtract
125 from each side)
(subtract
125 from each side)
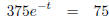 (divide
each side by 375)
(divide
each side by 375)
 (take the
natural log of each side)
(take the
natural log of each side)
-t = -1.609 (divide each side by -1)

(c) We already know from problem 5(c) that e-t → 0 as t → ∞. So as t → ∞, we have
So the limit of the population is 200 individuals.